HIGHLIGHTS
- Construction Materials and Mining Pty Ltd (CMM) secures exploration licence (EL 8786) on ground highly prospective for molybdenum mineralisation;
- Exploration by previous explorers outline a mineral resource (non-JORC) estimated at 1.4 million tonnes @ 0.11% Mo;
- A review of the documented geology and mineralisation indicates that the prospective horizons (Mo values in excess of 0.11%) are open in several directions;
- Historic data suggests a strong correlation between Mo values and garnet concentration;
- The price of molybdenum oxide has almost doubled over the last year, suggesting a significant change to its market dynamics. Potential for garnet (as an abrasive) is considered to be strong. Tungsten and other metals occur in significant quantities, some of which may be commercially viable;
- Initial field work indicates strong molybdenum values (over 1.0% Mo) in mine dump samples
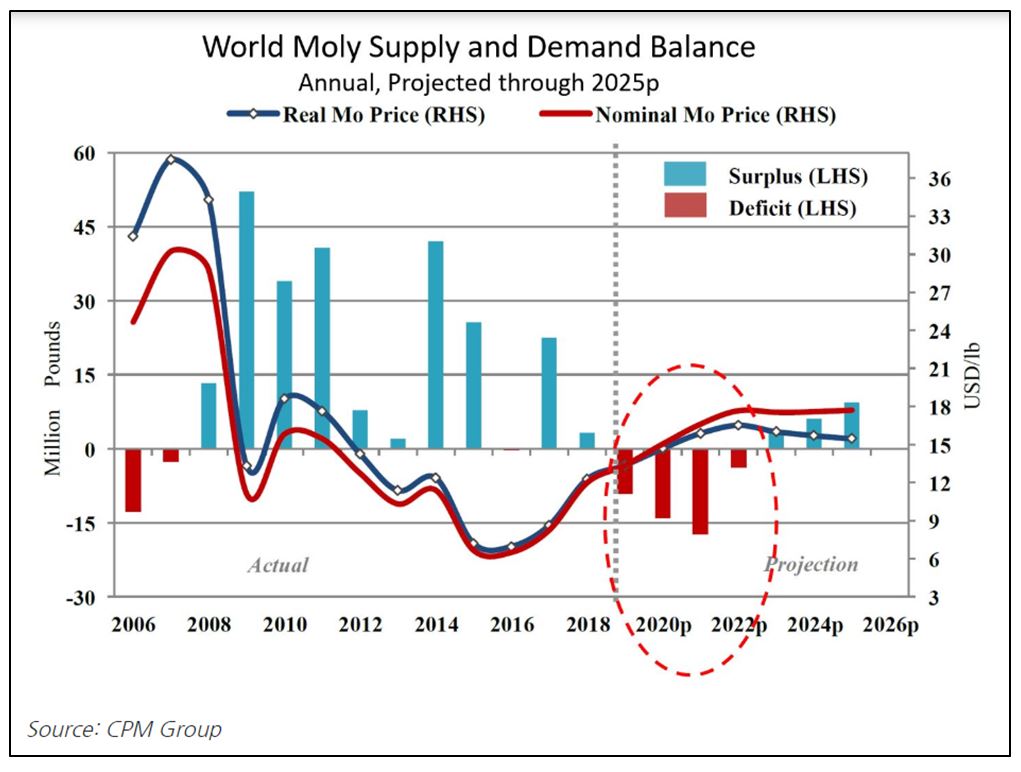
1.0 The Case for Molybdenum – Future Demand Projections
A review of molybdenum’s outlook in the short term indicated the continuance of a slow recovery in prices due to improving industrial demand (see – https://investingnews.com/daily/resource-investing/industrial-metals-investing/molybdenum-investing/molybdenum-outlook/). Since this review in late December 2017, prices have almost doubled – see Figure 1 below.
Part of this increased demand for Mo may have stemmed from recent scientific news from the USA, where researchers have recently discovered a major breakthrough in the manufacture of lithium sulphur batteries. In a recent article (see https://phys.org/news/2018-03-batteries.html), it was noted that whilst lithium sulphur batteries have been studied extensively (which are considered to be the natural evolution of lithium ion batteries), the inherent technology falls short when it comes to size and recharging limitations due to sulphur’s instability. These researchers have found that molybdenum improved the stability and compensated for the poor conductivity of sulphur, thus allowing for greater power density and hence making lithium – sulphur batteries more commercially viable.
2.0 Project Location and Access
Exploration Licence 8786 is located 20km east of Bathurst and approximately 140km west of Sydney in southern NSW (Figure 2) and was granted to CMM on 13th August, 2018 for a period of two (2) years. The mine adit and mullock piles of the Mt Tennyson Mo mine are located at 760,865mE and 6,289,571mN (Zone 55, AGD 66).

Access may be gained from Bathurst on the Great Western Highway, and turning south onto either Timber Ridge Road or Molybdonite (sic) Road approximately 20km from Bathurst, adjacent to the village of Yetholme. Access to the Mt Tennyson project area is via an unsealed public road and then passing through private farming land and forest in which the historic Mt Tennyson deposits are located.
The project area is mixed cleared grazing and pasture land with low topographic relief over the Mt Tennyson deposit, grading to moderate to steep topographic relief on the flank of Mt Tennyson.
3.0 Geology and Mineralisation
The project is located on the edge of the regionally extensive Bathurst Granite which outcrops with an approximate WNW orientation over an area of 1,600km2 along the Lachlan River Fracture Zone (LFRZ) also known as the Lachlan Transfer Zone (LTZ). Within the Bathurst Granite of local significance are the Bathurst, Tarana and Durandal Batholiths. The Bathurst Granite is a high-level, post kinematic intrusion of Carboniferous age that intrudes into sediments and volcanic units of Silurian, Ordovician and Devonian age (Weber et al., 1978). These units form part of the broader regional tectonic terrane known as the Hill End Trough.
The molybdenum deposits are confined to the south and eastern fringe of the Bathurst Batholith and are hosted in zones of metamorphosed (skarn type) sediments overlying intrusive granitoid apotheoses (Figure 3).
The Mt Tennyson Mo deposit is located on the southern slopes of Mt Tennyson and is hosted in a calc-silicate skarn belonging to the Turondale Formation of the Crudine Group. The Turondale Formation is a sequence of massive feldspathic to lithic sandstones, siltstones and conglomerates.
Overlying the skarn is a sequence of undifferentiated rocks belonging to the Turondale and Waterbeach Formations consisting primarily of feldspathic volcaniclastics in the project area with lesser greywacke and slate. Underlying the skarn are lithologies belonging to the Cookman Formation (Crudine Group) consisting of quartz sandstone, minor siltstone, shale and silicified tuff.
Mineralization is disseminated in a contact metamorphosed, calcareous cobble conglomerate unit that ranges from 1.5 to 12m thick. The unit is characterised by garnet-quartz-calcite-diopside skarn assemblages with accessory chlorite, amphibole, pyrite, magnetite, chalcopyrite and pyrrhotite. This is underlain in places by a wollastonite-garnet-diopside-quartz skarn. A poorly mineralised calc-silicate with weak a weak development of garnet ore mineralisation outcrops as the hanging wall. The major ore minerals are molybdenite and scheelite with accessory powellite. The rocks have been folded into a broad anticline, the apex of which marks Mt Tennyson.
The skarn is host to a non-compliant resource estimated by North Broken Hill in 1963 at 1,400,000t @ 0.11% Mo. Limited test work has reported grades of up to 994 ppm Rhenium within the molybdenum mineralization. Tungsten mineralisation has also been reported. The bulk of the resource is hosted in this broad, folded sheet of metamorphosed sedimentary rock. Within this unit, there are several narrow (0.5 – 1m) high-grade (up to 1.5% Mo) steeply dipping veins which trend north-south throughout the eastern side of the deposit. This high-grade Mo mineralization contains tabular crystals of Mo up to 30mm across.
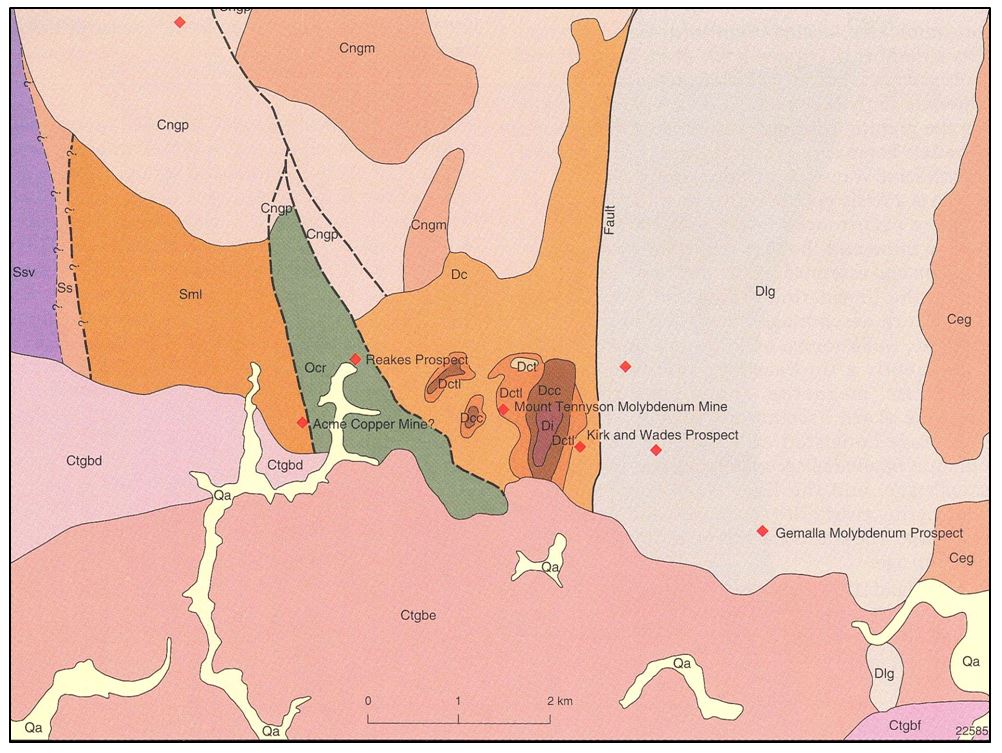
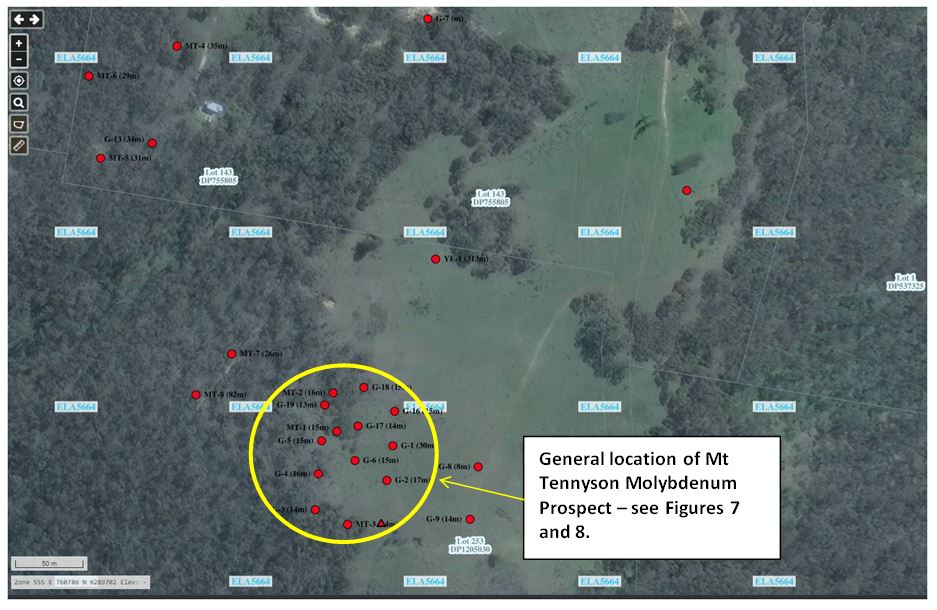
The location of the Mt Tennyson mine together with other recorded mineral prospects are illustrated in Figure 4.

4.0 HISTORICAL MINING AND PREVIOUS EXPLORATION
The Mt Tennyson Mo resource has been previously exploited by small-scale high-grade mining of narrow Mo veins. No exploitation has been undertaken of the larger low-grade ore-body at Mt Tennyson. The following summary has been adapted from annual exploration reports prepared by Moly Mines Limited.
1898 – 1918 Mammoth Molybdenum Mines Limited, Mt Tennyson Mines Limited.
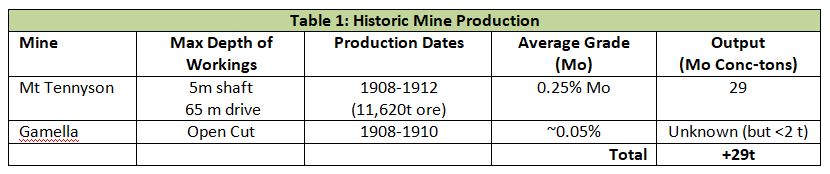
Activity involved prospecting and limited (11,620 t) mining of high-grade, narrow veins of Mo ore. Mining occurred sporadically over a period of several years. Mining was limited to readily accessible material on the eastern slope of Mt Tennyson. Very limited drilling was conducted. Historic Mo production for the area is presented in Table 1.
1941 Broken Hill Co. Pty Ltd (BHP)
During WWII exploration for the strategic mineral was undertaken. Only high-grade, low labour requirement operations were deemed worthy of prospecting and exploration focus soon went elsewhere. Prior to relinquishment, BHP conducted limited activity and outlined an estimate of 847,000t @ 0.1% Mo.
1959 – 1960 New Consolidated Gold Fields (AUST) Pty Ltd.
New Cons drilled nineteen diamond holes (DDH- to DDH-19) for an aggregate meterage of 357m. Poor core recovery was experienced.
1960 – 1964 North Broken Hill Ltd (North)
North became involved with the Mt Tennyson project after it lay dormant for several decades. They drilled eight diamond drill holes in 1964 (MT-1 to MT-8).
After failure to locate a high-grade zone within the deposit, North relinquished the tenure, but did note that there were considerable problems in the assay techniques employed. Indeed, the final report of 1964 noted, “Because of the critical nature of the assay values, further assaying is being carried out to check the discrepancies between values obtained by absortiometric and spectrophotometric methods”. No further open file information has been obtained to shed light on the outcome of test work, although later explorers noted North assay values were up to 30% lower than duplicated results.
North produced a resource estimate of 1,401,500t @ 0.11% Mo. It has been thought that is estimate of grade may be conservative.
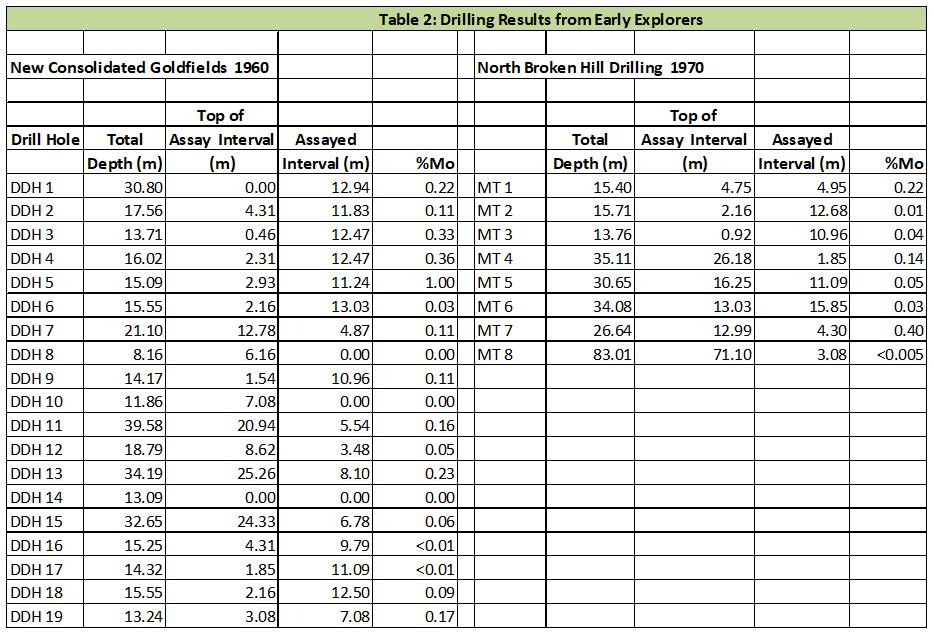
The location of drill holes completed by New Consolidated Gold Fields and North Broken Hill are illustrated in Figure 5 and summary assay results are depicted in Table 2. Values up to 1.00%Mo over 11 metres are recorded.
1974 – 1975 Geopeko Ltd (EL 689)
Surface sampling located elevated Tungsten values in Mo ore. Values ranged from 0.003 to 0.17% tungstic oxide, with low grade Mo mineralisation.
Also completed diamond drilling on the Endeavour 9 –Locksley Prospect. Elevated Cu, Pb and Zn values (up tp 0.615% recoded over 6 metre widths.
1995 – 1997 Minerals Corporation Limited
Limited work by Minerals Corporation indicated that garnet grades could be used as a predictor of Mo values. Observations made by Minerals Corporation included:
- The skarn unit which hosts the Mo mineralisation was considered to be originally a calcareous cobble conglomerate, with the base of this unit being dominated by wollastonite, whereas the upper part of the unit is dominated by a garnet/quartz/calcite/diopside assemblage;
- The skarn is stratiform in nature, with the dominant structural control being a shallow, southerly plunging anticline;
- Available drilling data indicated that there was insufficient data to accurately predict Mo grades – most drilling was vertical, yet high grades were found to occur in vertical to semi-vertical joints of faults. Due to this and the nature of Mo mineralisation, obtaining accurate grade estimates would be difficult;
- A re-logging of the North Broken Hill drilling results (See Table 2 above) indicated a strong correlation between garnet content and Mo grade. Of additional interest is that garnet content within these holes varied from approximately 8% to 22%.
- Minerals Corporation went on to estimate the presence of 1.4 million tonnes of skarn with an inferred molybdenum grade of 0.11% and a garnet grade of 17%. Approximately 900,000 tonnes of this material was estimated to be easily mineable, with a very low stripping ratio (ie, <1:1).
- Minerals Corporation commissioned Warman International Ltd to prepare flowsheets for the recovery of both garnet and the sulphide minerals (including molybdenite). No significant impediments to garnet and metal recoveries were indicated;
- A preliminary metallurgical assessment focusing on the garnet content was carried out for Minerals Corporation by Peter H Stitt and Associates in 1996. This work indicated an average recovery for the garnet of about 44%; and
- Further analysis indicated that concentrates will need to be further upgraded to enable their use for blast testing and that more cleaning in any commercial plant design will be required.
1988 – 2002
Several small companies have held the project in the past 15 years for Mo, although no serious exploration work appears to have been undertaken. No variation to resource figures published by BHP has been released.
Peel Exploration Limited 2010-2011 (EL 7272)
Peel Exploration Limited (Peel) held EL 7272 which was located immediately to the east of the Mt Tennyson Molybdenite workings. This licence incorporated the Kirks and Wade W Prospect, the Gemalla Mo Prospect and the Tarana Mo Prospect (see Figure 4).
Peel reported previous exploration results from the western portion of EL 7272 which included the completion of three diamond drill holes by Australian and New Zealand Exploration Company (ANZECO) into the Stony Creek Skarn. Results are summarised as follows:
DDH-1: 31 metres @0.16%W (including low grade Mo mineralisation)
DDH-2: Essentially barren
DDH-3: 23 metres @ 0.038%W and 0.052%Mo
Peel undertook to resample these drill holes in 2011, with the following general results:
DDH-1: 32 metres @0.11%W and 7.0 metres @ 0.186% Mo
DDH-2: Not sampled
DDH-3: 25 metres @ 0.029%W and 0.065%Mo
Peel also reported that ANZECO resampled three adits located within the Stony Creek Skarn for the following results:
Adit 1: 44 metres @ 0.14%WO3 and 0.033%Mo
Adit 2: 18 metres @ 0.06% WO3 and 0.067%Mo
Adit 3: 33.5 metres @ 0.17% WO3 and 0.13%Mo
Some of the prospective ground was located within land deemed to be environmentally sensitive restricting access without all of the necessary approvals, resulting in Peel abandoning the project.
2002 – 2012 Moly Mines Pty Ltd (EL 6017)
The work completed by Moly Mines and its associated predecessors includes the following:
2002-2008: Work completed by Moly Mines has included data compilation and appraisal, purchase and interpretation of remote sensing imagery, re-logging of core held at the Londonderry Core Library and re-assaying of selected intervals of core to aid in validation of historical data. Land access to the area of historical mining on Shady Springs property was achieved late in 2008 and unrestricted reconnaissance field trip was completed. In the initial 2002-2003 Annual Report, it was indicted that additional credits in any future mining could be obtained from W and Re credits. It was further reported that rock chip sampling had returned values up to 994 ppm Re and 0.17% W02 in Mo bearing samples.
Results from the re-assaying of core in 2005 indicated comparable if not slightly higher Mo values as well as highly anomalous W values throughout all samples assayed.
2009: Field access during the reporting period was largely restricted to desktop work revolved around planning a 3D offset pole-dipole survey. The proposed IP survey required the remote transmit station to be located on an adjoining exploration license owned by Peel Exploration Pty Ltd. within a state forest, both of which required onerous negotiations. These delays and the availability of geophysical contractors meant that the survey was delayed until early 2010.
2010: Moly Ex conducted a dipole-dipole Induced Polarisation (IP) Survey at Mt Tennyson. Results from this survey were very encouraging and indicated two conductive zones; one in the north of the survey area adjacent to the Duronal Stock; and one at depth at the southern end of the survey area adjacent to the historic Mammoth Mine; however this survey has limited resolution at depths greater than 50 meters.
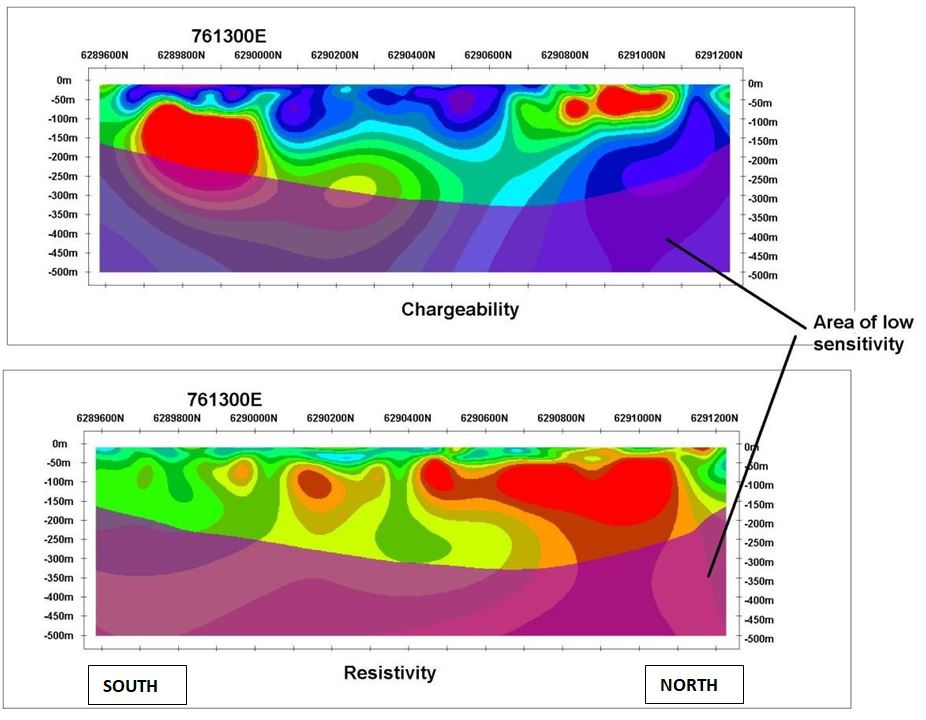
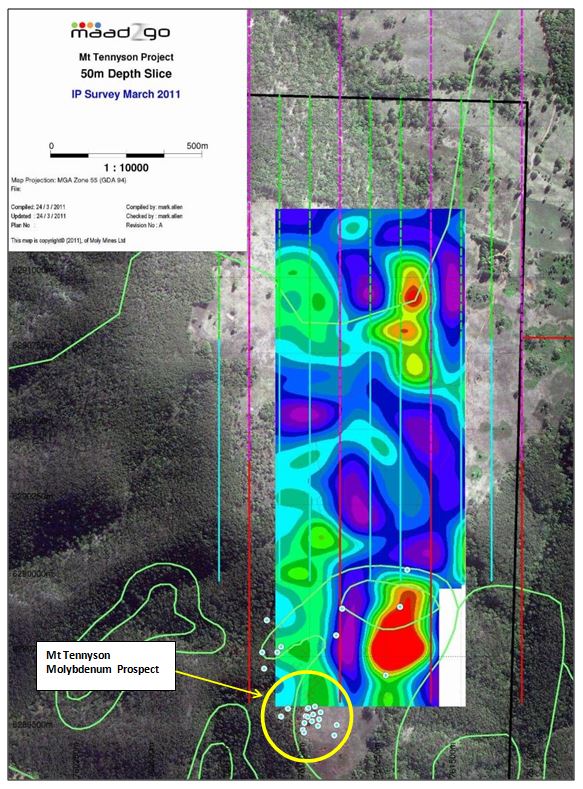
2011: An Induced Polarisation survey was conducted by Fender Geophysics in February-March 2011. This offset dipole survey was a follow up to a simple dipole-dipole survey that was carried out in March 2010 and provided greater resolution at depth as well as having a slight northerly extension to both the transmit and receive lines. The results of this survey are illustrated in Figures 6 and 7 and demonstrate the presence of at least two strong anomalies.
2012 A drill program was planned and approved by DPI although no field work was undertaken due to a lack of drill rig availability, later followed by budgetary constraints within the company. Figure 10 shows the RC drilling program that was planned to confirm presence of Molybdenum Sulphide within zones identified as chargeable targets from the March 2011 Induced Polarisation survey. Approximately 1050m of RC drilling was proposed to test the mineralisation of chargeability targets generated from the recent offset dipole IP survey. A total of 6 angled drill holes were planned to either 150m or 250m.
It was recommended that any future exploration companies that acquire this ground seriously consider initiating a program to drill test these IP targets where budgeting permits.
Clancy Exploration Limited 2015-2016 (EL 8226)
Clancy Exploration Limited carried out a review of previous exploration data. It was concluded that follow-up work needs to be completed on the IP surveys carried out by Moly Mines. This was to include re-processing and interpretation of the data, followed up by RC drilling of the IP targets. Clancy abandoned the licence before any work was undertaken.
5.0 EXPLORATION POTENTIAL
Several areas of exploration and development potential have been recognised and include the following:
- The licence is highly prospective for Molybdenum and Tungsten mineralisation. Other metals with potential include Rhenium, Rubidium and Lanthanum;
- The potential for developing the garnet content is considered high, with early results indicating an average content of 17% of the skarn. Based on the historic data provided by Minerals Corporation Limited, over 100,000 tonnes of garnet could be recovered by simple metallurgical processes from the Mt Tennyson prospect alone;
- Drilling results at the Mt Tennyson Molybdenite Prospect area from the 1960’s have demonstrated attractive Mo results which have never been followed up. Given the shallow nature of the Mo mineralisation in this area, an intensive RC drilling program, subject to preliminary geophysical and geological surveys, is recommended with the objective of confirming and expanding upon the resources already delineated and upgrading the results to JORC 2012 standard – see Figure 8.
- IP survey data (Figure 7) indicates the presence of significant IP anomalies. Consideration should be given to reviewing the existing data and expanding the survey to the west and south with the objective of defining more closely the response of the Mt Tennyson mineralisation.
- The licence area contains a number of other Mo, W and base metal prospects which need to be assessed according to modern exploration technology. These include the Reakes Copper Prospect, Acme Copper Mine, Kirk and Wade Mo + W Prospect and Tarana Molybdenite Prospect (see Figure 4) to name a few.
6.0 EXPLORATION ACTIVITIES
6.1 Property Owners
Initial exploration activities have commenced with the identification of the main property owners in and around the main historic molybdenum prospects and the introduction of CMM Pty Ltd. In all cases to date, the property owners have been very helpful and informative and have indicated no objection to further exploration activities. Once these activities are at a stage where drilling is to be introduced, formal compensation and access agreements will be tendered.
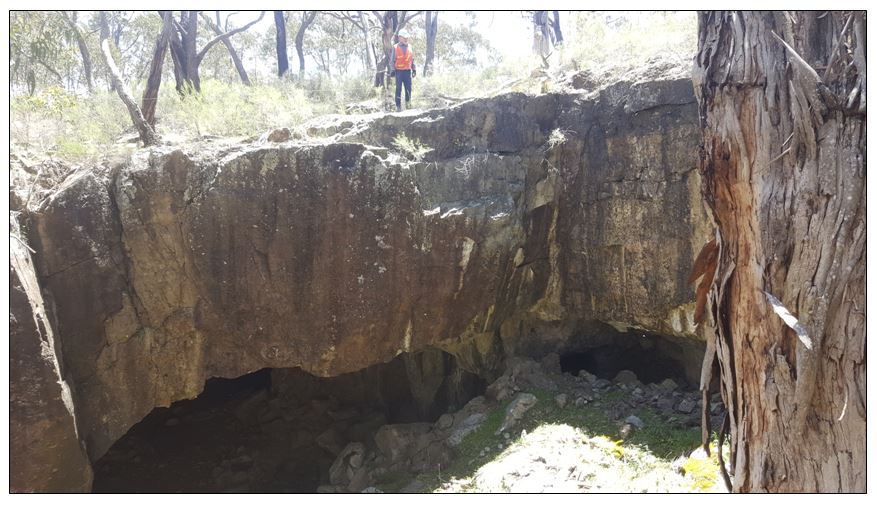
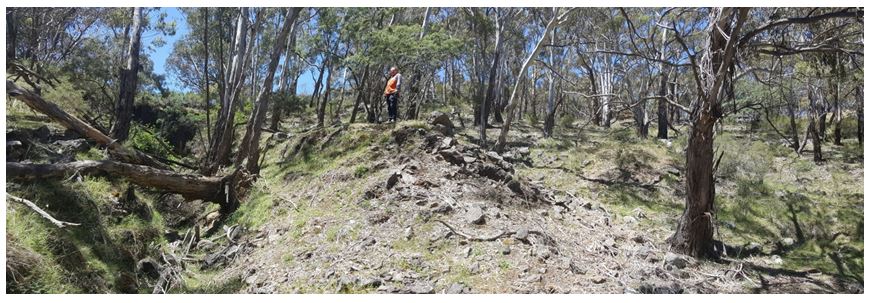
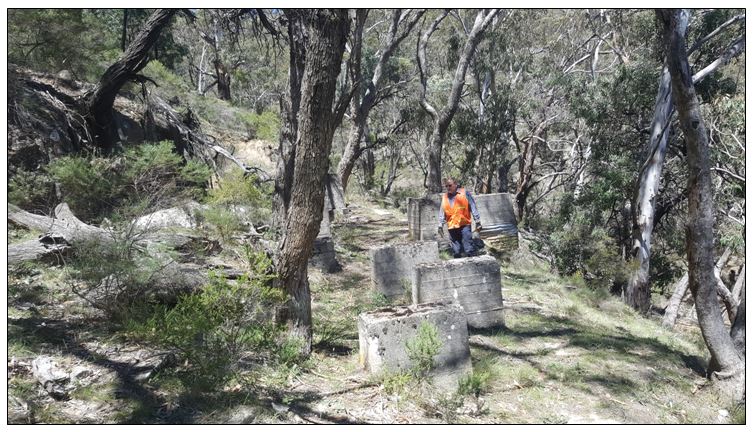
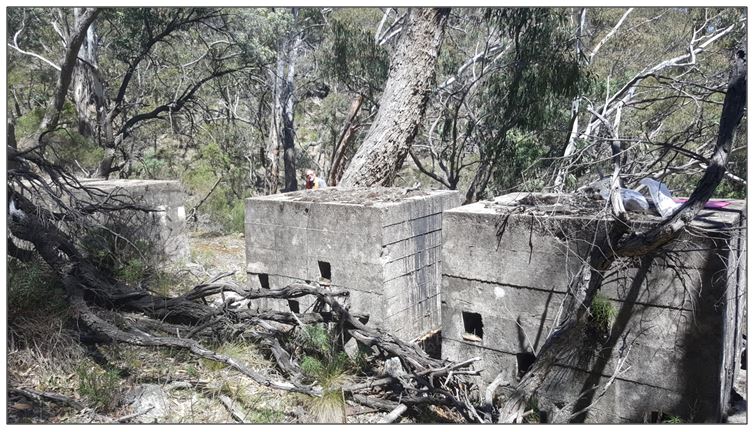
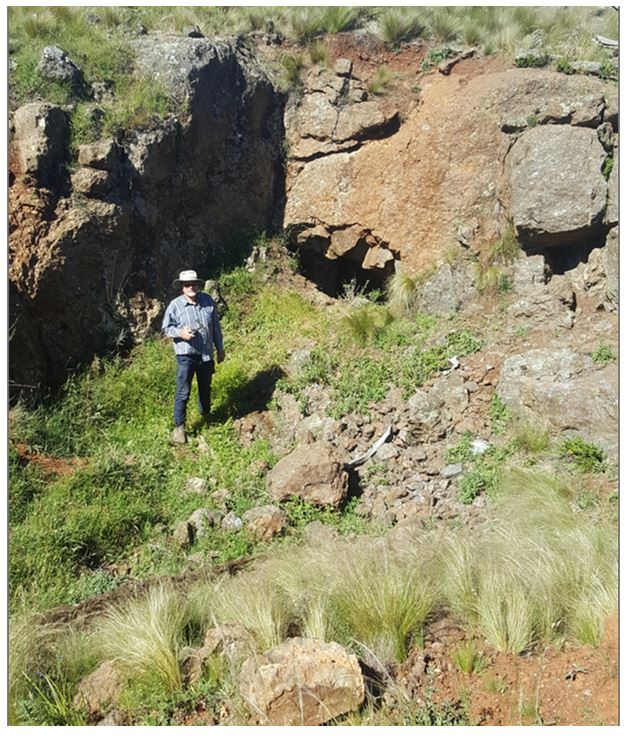
6.2 Initial Inspections and Sampling
The initial inspections were focused on the main mine workings illustrated in the following plates.


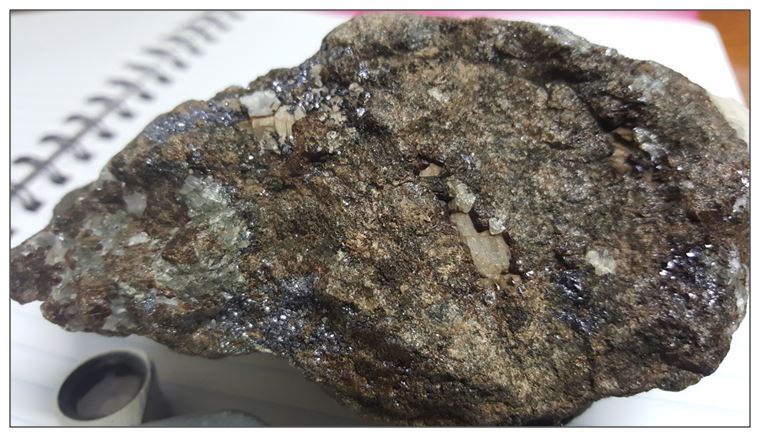
6.3 Sampling Results
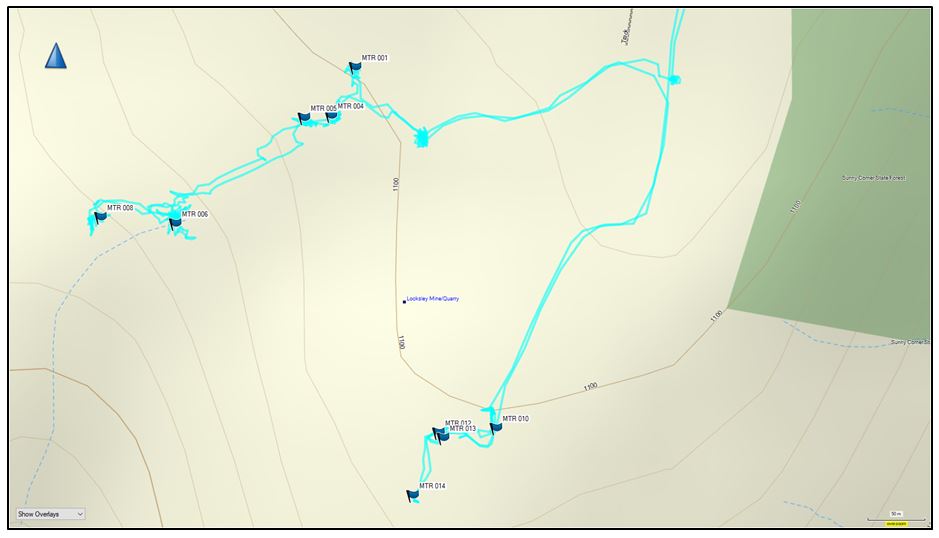
The initial sampling was focused on high grade Molybendum bearing ore and associated “hanging wall” skarn, with the objective of obtaining the main metal and mineral associations which would be utilised in upcoming exploration programs. The location of the initial rock – chip sampling is illustrated on Figure 8 (see also area circled in yellow in Figure 7), with the results outlined in Table 3.
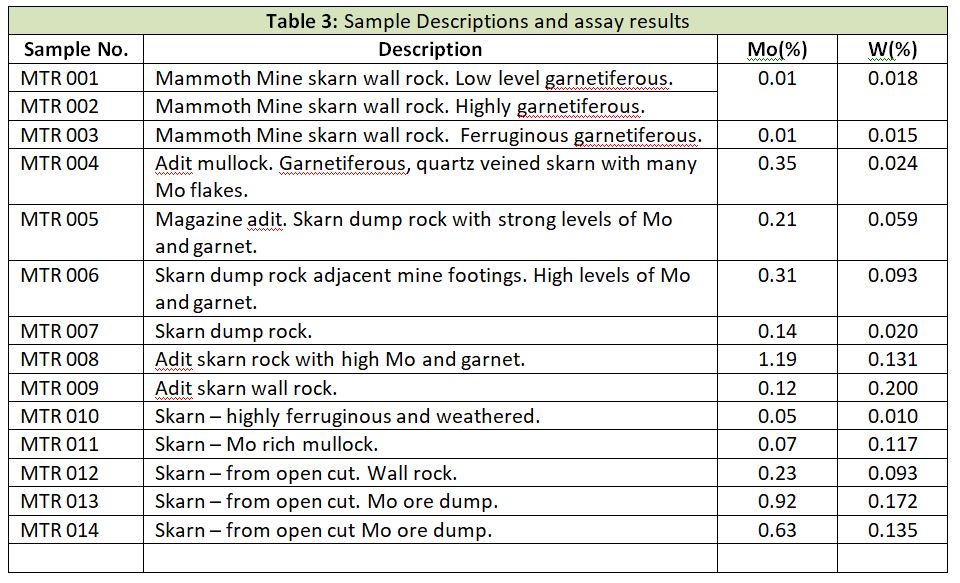
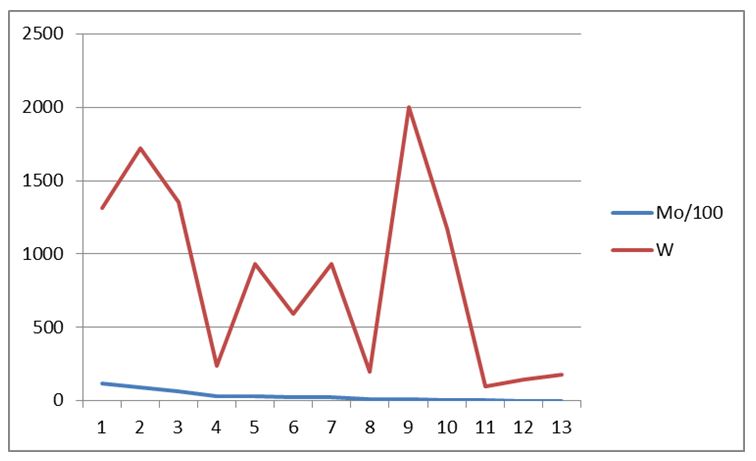
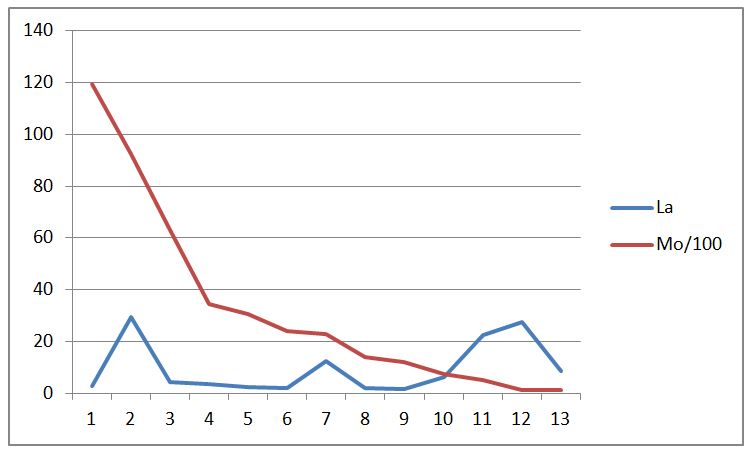
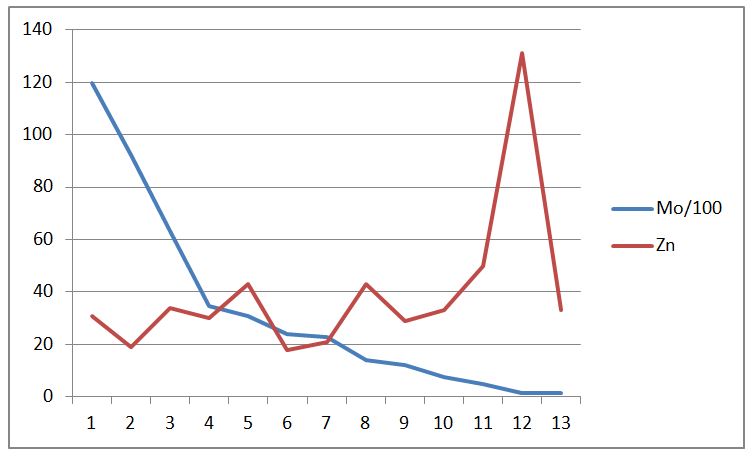
A review of the limited laboratory data indicates that there is little correlation between Mo and other metals. This observation is borne out by several examples given below whereby Mo values were listed from highest to lowest (Left to right on the horizontal axis) and then compared to other corresponding metal values.


At this early stage, the strong correlation between Mo and garnet content reported by Minerals Corporation Limited in the late 1990’s appears to be the best geochemical correlation and an excellent exploration tool.
Anecdotal information indicates that the likely composition of the garnet is grossularite – andradite solid solution. The proportions of each end member will vary but will probably be Grossularite-rich. It is further anticipated that the garnets will have a hardness of between 6.5 and 7.5.
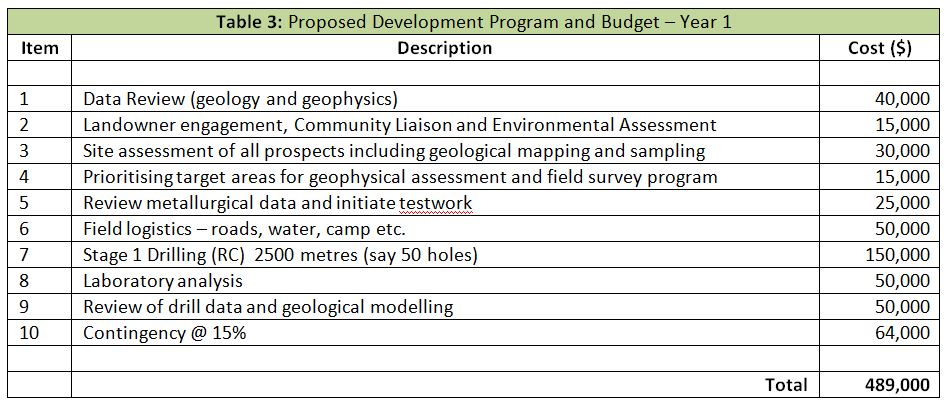
7.0 EXPLORATION AND DEVELOPMENT PROGRAM AND BUDGET
The budget for the proposed Year 1 (2019) exploration and development program is approximately $0.489 million and is detailed in Table 3.